Welcome to DU!
The truly grassroots left-of-center political community where regular people, not algorithms, drive the discussions and set the standards.
Join the community:
Create a free account
Support DU (and get rid of ads!):
Become a Star Member
Latest Breaking News
Editorials & Other Articles
General Discussion
The DU Lounge
All Forums
Issue Forums
Culture Forums
Alliance Forums
Region Forums
Support Forums
Help & Search
Environment & Energy
In reply to the discussion: The Underestimated Role of Rivers as a Source of Greenhouse Gases [View all]
OKIsItJustMe
(22,401 posts)11. Sigh... What is Table A.1b?
Excerpts in this reply are drawn from a Creative Commons source:
IEA (2025), World Energy Outlook 2025, IEA, Paris https://www.iea.org/reports/world-energy-outlook-2025, Licence: CC BY 4.0 (report); CC BY NC SA 4.0 (Annex A)
Table A.1b comes from the “Annex” which contains many tables:
General note to the tables
This annex includes global historical and projected data by scenario for the following five datasets:
Each dataset is given for the following scenarios: (a) Current Policies Scenario (CPS) [Tables A.1a. to A.5a]; (b) Stated Policies Scenario (STEPS) [Tables A.1b. to A.5b]; and (c) Net Zero Emissions by 2050 (NZE) Scenario [Tables A.1c. to A.5c].
You have chosen A.1b the "Stated Policies Scenario" (STEPS) Why not look at table A.1a "Current Policies Scenario" (CPS) or A.1c Net Zero Emissions by 2050 (NZE) Scenario? (this, of course is our goal, if you really care about the climate.)
This annex includes global historical and projected data by scenario for the following five datasets:
- A.1: World energy supply.
- A.2: World total final consumption.
- A.3: World electricity sector: gross electricity generation and electrical capacity.
- A.4: World CO₂ emissions: carbon dioxide (CO₂) emissions from fossil fuel combustion and industrial processes.
- A.5: World economic and activity indicators: selected economic and activity indicators.
Each dataset is given for the following scenarios: (a) Current Policies Scenario (CPS) [Tables A.1a. to A.5a]; (b) Stated Policies Scenario (STEPS) [Tables A.1b. to A.5b]; and (c) Net Zero Emissions by 2050 (NZE) Scenario [Tables A.1c. to A.5c].
It’s surprising you include the table at all, since it includes figures for years which are in the future. You generally refer to this as “soothsaying” (which is bad.) Strange, I thought one of the primary purposes of science was to make predictions… No worries though, these are not predictions, they are scenarios.
From the Executive Summary:
There is no single storyline about the future of energy, which is why the World Energy Outlook presents multiple scenarios, none of which is a forecast. The framework presented in this Outlook is based on the latest and most comprehensive data on policies, technologies and markets, together with rigorous modelling. This allows readers to explore the implications of different choices and pathways.
Scenarios
The World Energy Outlook 2025 (WEO-2025) has three main scenarios. Two of these set starting conditions and then examine where they lead – the Current Policies Scenario (CPS) and the Stated Policies Scenario (STEPS). A third, the Net Zero Emissions by 2050 (NZE) Scenario, maps out a pathway to achieve specific energy and climate-related goals.
The continued rise of renewable energy
The pace varies, but renewables grow faster than any other major energy source in all scenarios, led by solar photovoltaics (PV). In the CPS, where they face stronger headwinds, renewables still meet the largest share of total energy demand growth, followed by natural gas and oil, even though annual solar PV additions in the power sector stall at around today’s levels of 540 GW to 2035. In the STEPS, policy changes mean that the United States has 30% less renewables capacity installed in 2035 than in last year’s Outlook, but at the global level renewables continue their rapid expansion. A boom in solar deployment is accompanied by robust growth across wind, hydropower, bioenergy, geothermal and other technologies, and by improvements in energy efficiency. China continues to be the largest market for renewables, accounting for 45-60% of global deployment over the next ten years across the scenarios, and remains the largest manufacturer of most renewable technologies.
Scenarios
The World Energy Outlook 2025 (WEO-2025) has three main scenarios. Two of these set starting conditions and then examine where they lead – the Current Policies Scenario (CPS) and the Stated Policies Scenario (STEPS). A third, the Net Zero Emissions by 2050 (NZE) Scenario, maps out a pathway to achieve specific energy and climate-related goals.
- The Current Policies Scenario considers a snapshot of policies and regulations that are already in place and offers a cautious perspective on the speed at which new energy technologies are deployed and integrated into the energy system.
- The Stated Policies Scenario considers the application of a broader range of policies, including those that have been formally put forward but not yet adopted, as well as other official strategy documents that indicate the direction of travel. Barriers to the introduction of new technologies are lower than in the CPS, but the STEPS does not assume that aspirational targets are met.
- The Net Zero Emissions by 2050 Scenario takes a different approach, describing a pathway to reduce global energy-related carbon dioxide (CO₂) emissions to net zero by 2050, while recognising that each country will have its own route.
The continued rise of renewable energy
The pace varies, but renewables grow faster than any other major energy source in all scenarios, led by solar photovoltaics (PV). In the CPS, where they face stronger headwinds, renewables still meet the largest share of total energy demand growth, followed by natural gas and oil, even though annual solar PV additions in the power sector stall at around today’s levels of 540 GW to 2035. In the STEPS, policy changes mean that the United States has 30% less renewables capacity installed in 2035 than in last year’s Outlook, but at the global level renewables continue their rapid expansion. A boom in solar deployment is accompanied by robust growth across wind, hydropower, bioenergy, geothermal and other technologies, and by improvements in energy efficiency. China continues to be the largest market for renewables, accounting for 45-60% of global deployment over the next ten years across the scenarios, and remains the largest manufacturer of most renewable technologies.
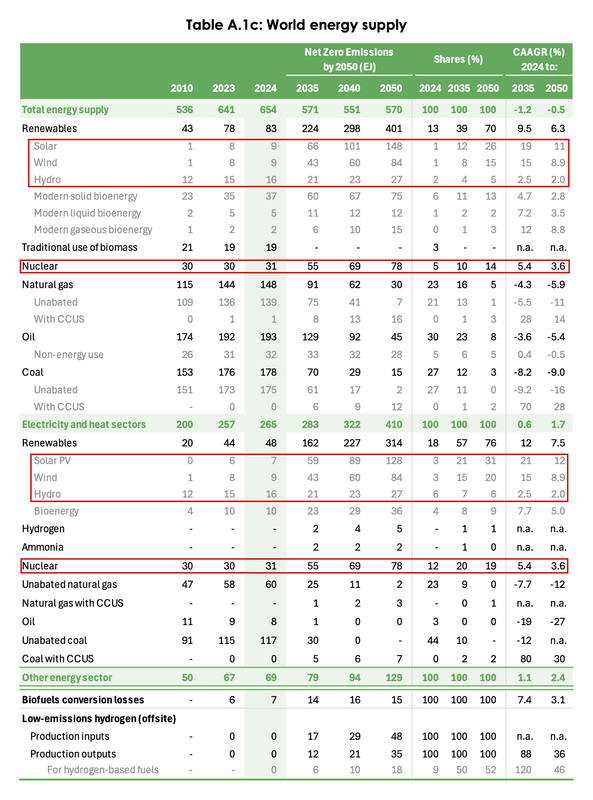
If you read the table, you should see that Solar, Wind & Hydro (combined) already produce more energy than “Nuclear.” Under the Net Zero Emissions by 2050 Scenario, by 2050, Wind by itself will provide more energy than nuclear, and solar will provide almost twice as much.
Edit history
Please sign in to view edit histories.
Recommendations
0 members have recommended this reply (displayed in chronological order):
11 replies
 = new reply since forum marked as read
Highlight:
NoneDon't highlight anything
5 newestHighlight 5 most recent replies
RecommendedHighlight replies with 5 or more recommendations
= new reply since forum marked as read
Highlight:
NoneDon't highlight anything
5 newestHighlight 5 most recent replies
RecommendedHighlight replies with 5 or more recommendations
= new reply since forum marked as read
Highlight:
NoneDon't highlight anything
5 newestHighlight 5 most recent replies
RecommendedHighlight replies with 5 or more recommendations
This is a good example of how Data Science is helping in the investigation of Global Warming
thought crime
Apr 28
#3