Welcome to DU!
The truly grassroots left-of-center political community where regular people, not algorithms, drive the discussions and set the standards.
Join the community:
Create a free account
Support DU (and get rid of ads!):
Become a Star Member
Latest Breaking News
Editorials & Other Articles
General Discussion
The DU Lounge
All Forums
Issue Forums
Culture Forums
Alliance Forums
Region Forums
Support Forums
Help & Search
Environment & Energy
Related: About this forumThe Underestimated Role of Rivers as a Source of Greenhouse Gases
https://www.kit.edu/kit/english/pi_2026_033_the-underestimated-role-of-rivers-as-a-source-of-greenhouse-gases.phpKIT Researchers Show How Climate Change and Land Use Turn Rivers into Greenhouse Gas Sources
Rivers worldwide are under severe stress: They are warming, losing oxygen and as a result emitting increasing amounts of greenhouse gases. Researchers at Karlsruhe Institute of Technology (KIT) have now quantified these global trends over a period of more than two decades. Their results show that rising temperatures and anthropogenic land use are fundamentally transforming river systems, with serious consequences for the climate. The findings have been published in Global Change Biology. (DOI: 10.1111/gcb.70828)
Rivers are habitats, sources of water, and shapers of entire cultural landscapes. Accordingly, the local impacts are severe when agriculture and industry place pressure on river systems. “Rivers also play a key role in the global climate system,” said Dr. Ralf Kiese of the Institute of Meteorology and Climate Research – Atmospheric Environmental Research (IMKIFU) at KIT’s Campus Alpin in Garmisch-Partenkirchen. “We are increasingly observing that rivers are becoming a significant source of greenhouse gases.” This is mainly due to biogeochemical decomposition processes involving microorganisms: Organic carbon and nutrients entering rivers from farming or wastewater are converted into carbon dioxide, nitrous oxide, and methane – greenhouse gases with an adverse effect on the atmosphere.
Machine Learning Complements Missing Data
For a first-time global quantification of these trends, the researchers combined measurement data with satellite maps and machine learning. Their study is based on water parameter measurements from more than 1,000 river monitoring sites. They linked these measurements with globally available satellite information on vegetation, radiation, and topography. Based on this combined data, computations using machine learning models revealed how these environmental factors affect water temperatures, oxygen levels, and increasing greenhouse gas concentrations. The researchers then applied the resulting relationship data to more than 5,000 additional catchments worldwide to reconstruct, for the first time, consistent time series from 2002 to 2022, even for regions where no measurement data was available.
The evaluations revealed definite global trends: Rivers are warming, losing oxygen, and becoming increasingly saturated with greenhouse gases. “On average, the oxygen content is decreasing by 0.058 milligrams per liter and decade, much faster than in lakes and oceans. At the same time, the emissions of carbon dioxide, methane and nitrous oxide are rising,“ said Dr. Ricky Mwanake of IMKIFU, who was mainly responsible for the computations. “Overall, we estimate that the additional anthropogenic emissions from rivers during the study period from 2002 to 2022 amounted to approximately 1.5 billion metric tons of CO₂ equivalent. These additional emissions weren’t accounted for in the existing global greenhouse gas budgets.”
…
Mwanake, R. M., E. G.Wangari, and R.Kiese. 2026. “Rising Global Riverine Deoxygenation Rates and GHG Emissions Driven by the Synergistic Effects of Warming and Anthropogenic Land Use Expansion.” Global Change Biology32, no. 3: e70828. https://doi.org/10.1111/gcb.70828.Rivers worldwide are under severe stress: They are warming, losing oxygen and as a result emitting increasing amounts of greenhouse gases. Researchers at Karlsruhe Institute of Technology (KIT) have now quantified these global trends over a period of more than two decades. Their results show that rising temperatures and anthropogenic land use are fundamentally transforming river systems, with serious consequences for the climate. The findings have been published in Global Change Biology. (DOI: 10.1111/gcb.70828)
Rivers are habitats, sources of water, and shapers of entire cultural landscapes. Accordingly, the local impacts are severe when agriculture and industry place pressure on river systems. “Rivers also play a key role in the global climate system,” said Dr. Ralf Kiese of the Institute of Meteorology and Climate Research – Atmospheric Environmental Research (IMKIFU) at KIT’s Campus Alpin in Garmisch-Partenkirchen. “We are increasingly observing that rivers are becoming a significant source of greenhouse gases.” This is mainly due to biogeochemical decomposition processes involving microorganisms: Organic carbon and nutrients entering rivers from farming or wastewater are converted into carbon dioxide, nitrous oxide, and methane – greenhouse gases with an adverse effect on the atmosphere.
Machine Learning Complements Missing Data
For a first-time global quantification of these trends, the researchers combined measurement data with satellite maps and machine learning. Their study is based on water parameter measurements from more than 1,000 river monitoring sites. They linked these measurements with globally available satellite information on vegetation, radiation, and topography. Based on this combined data, computations using machine learning models revealed how these environmental factors affect water temperatures, oxygen levels, and increasing greenhouse gas concentrations. The researchers then applied the resulting relationship data to more than 5,000 additional catchments worldwide to reconstruct, for the first time, consistent time series from 2002 to 2022, even for regions where no measurement data was available.
The evaluations revealed definite global trends: Rivers are warming, losing oxygen, and becoming increasingly saturated with greenhouse gases. “On average, the oxygen content is decreasing by 0.058 milligrams per liter and decade, much faster than in lakes and oceans. At the same time, the emissions of carbon dioxide, methane and nitrous oxide are rising,“ said Dr. Ricky Mwanake of IMKIFU, who was mainly responsible for the computations. “Overall, we estimate that the additional anthropogenic emissions from rivers during the study period from 2002 to 2022 amounted to approximately 1.5 billion metric tons of CO₂ equivalent. These additional emissions weren’t accounted for in the existing global greenhouse gas budgets.”
…
11 replies
 = new reply since forum marked as read
Highlight:
NoneDon't highlight anything
5 newestHighlight 5 most recent replies
= new reply since forum marked as read
Highlight:
NoneDon't highlight anything
5 newestHighlight 5 most recent replies
= new reply since forum marked as read
Highlight:
NoneDon't highlight anything
5 newestHighlight 5 most recent replies
The Underestimated Role of Rivers as a Source of Greenhouse Gases (Original Post)
OKIsItJustMe
Apr 28
OP
This is a good example of how Data Science is helping in the investigation of Global Warming
thought crime
Apr 28
#3
Response to OKIsItJustMe (Original post)
NNadir This message was self-deleted by its author.

OKIsItJustMe
(22,400 posts)2. Don't make me your strawman
…
I'm sure of course, I will now hear from an "I'm not an antinuke" antinuke about cooling water from nuclear plants drawn from rivers. There's not one among them however who would make the same complaint about the other Rankine devices about which they couldn't care less, coal and gas plants.
…
I'm sure of course, I will now hear from an "I'm not an antinuke" antinuke about cooling water from nuclear plants drawn from rivers. There's not one among them however who would make the same complaint about the other Rankine devices about which they couldn't care less, coal and gas plants.
…

thought crime
(1,832 posts)4. I feel like I should complain about Rankine devices. Damn them.

OKIsItJustMe
(22,400 posts)5. Was it something I said?
The post was self-deleted!
thought crime
(1,832 posts)7. I was trying to be sarcastic...

OKIsItJustMe
(22,400 posts)9. Right
I was talking about the poster who withdrew his own posting.

thought crime
(1,832 posts)10. LOL You were right on.

OKIsItJustMe
(22,400 posts)6. Clean energy can help to ease the water crisis
?si=rlioOs_D__fIcdYh
https://www.iea.org/commentaries/clean-energy-can-help-to-ease-the-water-crisis
https://local21news.com/news/local/three-mile-island-nuclear-plant-requests-daily-73m-gallon-from-susquehanna-river
https://www.iea.org/commentaries/clean-energy-can-help-to-ease-the-water-crisis
Clean energy can help to ease the water crisis
…
In the Stated Policies Scenario (STEPS) – our most conservative scenario which only takes into account energy transition measures that have been implemented or are under development – energy’s thirst for water continues to rise and reaches nearly 400 bcm by 2030. This is mostly driven by a growth in withdrawals for cooling nuclear power plants and to irrigate bioenergy feedstocks. Some of this increase is offset by the shift from fossil fuels to solar PV and wind in the power sector.
Energy uses less water in a net zero emissions pathway
In the Net Zero Emissions by 2050 Scenario (NZE) – our most ambitious scenario – water withdrawals by the energy sector decline by almost 20 bcm by 2030. The biggest reductions happen in the power sector, where withdrawals fall nearly 15% as coal-fired power generation is quickly replaced by solar PV and wind. Greater energy efficiency also plays an important role in reducing the volume of water needed to meet global energy demand.
…
Thermal power plants often require water for cooling. France’s Chooz nuclear power plant was closed for around two months when a severe drought hit in 2020, and several other plants had to reduce output in 2022 due to lack of cooling water.
…
…
In the Stated Policies Scenario (STEPS) – our most conservative scenario which only takes into account energy transition measures that have been implemented or are under development – energy’s thirst for water continues to rise and reaches nearly 400 bcm by 2030. This is mostly driven by a growth in withdrawals for cooling nuclear power plants and to irrigate bioenergy feedstocks. Some of this increase is offset by the shift from fossil fuels to solar PV and wind in the power sector.
Energy uses less water in a net zero emissions pathway
In the Net Zero Emissions by 2050 Scenario (NZE) – our most ambitious scenario – water withdrawals by the energy sector decline by almost 20 bcm by 2030. The biggest reductions happen in the power sector, where withdrawals fall nearly 15% as coal-fired power generation is quickly replaced by solar PV and wind. Greater energy efficiency also plays an important role in reducing the volume of water needed to meet global energy demand.
…
Thermal power plants often require water for cooling. France’s Chooz nuclear power plant was closed for around two months when a severe drought hit in 2020, and several other plants had to reduce output in 2022 due to lack of cooling water.
…
https://local21news.com/news/local/three-mile-island-nuclear-plant-requests-daily-73m-gallon-from-susquehanna-river
Three Mile Island seeks 73M gallons from Susquehanna for data center as PA drought looms
by Matthew Duckworth Fri, April 24, 2026 at 6:00 AM
Updated Fri, April 24, 2026 at 11:32 AM
DAUPHIN COUNTY, Pa. (WHP) — The site of the "worst commercial nuclear incident in United States history" is asking to pull around 73 million gallons of water from the Susquehanna River to feed new proposed Microsoft data centers, as several counties reportedly continue to experience abnormal-to-severe drought levels.
Constellation Energy has asked the Susquehanna River Basin Commission for permission to pull 73.2 million gallons of water daily from the river ahead of the expected 2027 restart of the Crane Clean Energy Center, formerly known as Three Mile Island.
…
“Repowering a dangerous, resource-intensive nuclear plant in the middle of a drought all to feed unwanted AI data centers is a recipe for disaster. Constellation and Microsoft’s plan to take tens of millions of gallons of water out of the water cycle is a clear example of corporations prioritizing profits over people and our environment," Beauchamp claimed.
His claim echoed through the room on the heels of the river experiencing low-flow conditions on April 14, which triggered stop orders for water-fracking-related activities across three Pennsylvania counties.
…

NNadir
(38,842 posts)8. I apologize...
...for my fat fingers on a cell phone keyboard, which led me to delete rather than edit the post as intended.
Thank you for preserving a key part of it, which reflects my actual experience. It's better that I write a response at my home computer, which is where I keep my scientific and pat responses to antinukes and "I'm not an antinuke" antinukes.
So thanks again for this:
I'm sure of course, I will now hear from an "I'm not an antinuke" antinuke about cooling water from nuclear plants drawn from rivers. There's not one among them however who would make the same complaint about the other Rankine devices about which they couldn't care less, coal and gas plants.
You see, every once in a while the rivers in France get really hot and antinukes - and "I'm not an antinuke" antinukes - point out to me, as if the this made nuclear energy unreliable, a criteria that they never apply to the thing they push relentlessly, so called "renewable energy" during month (or longer) episodes of Dunkelflaute when they happily burn coal and gas in antinuke heaven, Germany.
That was the complaint registered by antinukes years ago, that nuclear energy was unreliable, to go with nuclear energy is "too expensive" and other delusional claptrap.
(Germany, antinuke heaven! Don't worry; be happy, someday there'll be a hydrogen nirvana; one can build gas plants at will in Germany if you claim that someday they'll run on hydrogen "by 2040." This is amazing, if you think about it, in the country where Ludwig Boltzmann once lived and rationalized the laws of thermodynamics.)
Sigh...
Ah, the good ole, "Strawman" complaint from an "I'm not an antinuke" antinuke. I love it. Once upon a time here there was an antinuke around here, I mean an "I'm not an antinuke" antinuke who I claimed - antinukes are rather witless and don't understand sarcasm unless it comes with one of those internet thingies people seem to need - was more concerned that a radioactive atom would tunnel into his little brain than he was with the collapse of the planetary atmosphere. This concerned the collapse of an old railroad tunnel at the Hanford Reservation containing some old Purex or Bismuth chemical reactors for the extraction of plutonium stored on forgotten rail cars.
In response to complaints about this being a strawman, I set out, at first as a mocking joke, to figure out exactly how many radioactive atoms actually might end up in the brain of an "I'm not an antinuke" antinuke, but I got carried away with it, because the subject of how a radioactive atom might actually travel to an antinuke's brain turned out to be fascinating, at least for me. The post, to which I still sometimes refer was this one:
828 Underground Nuclear Tests, Plutonium Migration in Nevada, Dunning, Kruger, Strawmen, and Tunnels
Anyway, I did want to reify my feeling about a "Renewables will save us" type complaining about the state rivers.
I repeat the part in unintentionally deleted post about the Sierra Club, founded by John Muir to fight the destruction of the Tuolumne River and the Hetch Hetchy valley for so called "renewable energy" - a fight to preserve wilderness that he lost - and the difference involved with the modern Sierra Club, which if I paraphrase my original accidentally deleted post, where the modern membership never sees a wilderness that it doesn't want to transform into an industrial park for solar and wind powerplants, none of which are as reliable as destroying a river with dams, although, there's some question whether the Glen Canyon dam, built when "environmentalist" David Brower traded the Glen Canyon for the Grand Canyon, as if either belonged to him.
I often hear from antinukes that so called "renewable energy" is surging, because the IEA defines strip mining forests for biomass, and hydroelectricity as "renewable energy." I, of course, love to post the data table, from the latest World Energy Outlook, where biomass combustion and hydro are defined as "renewable" to make this point, while crediting the data but not the soothsaying:
World Energy Outlook 2025:
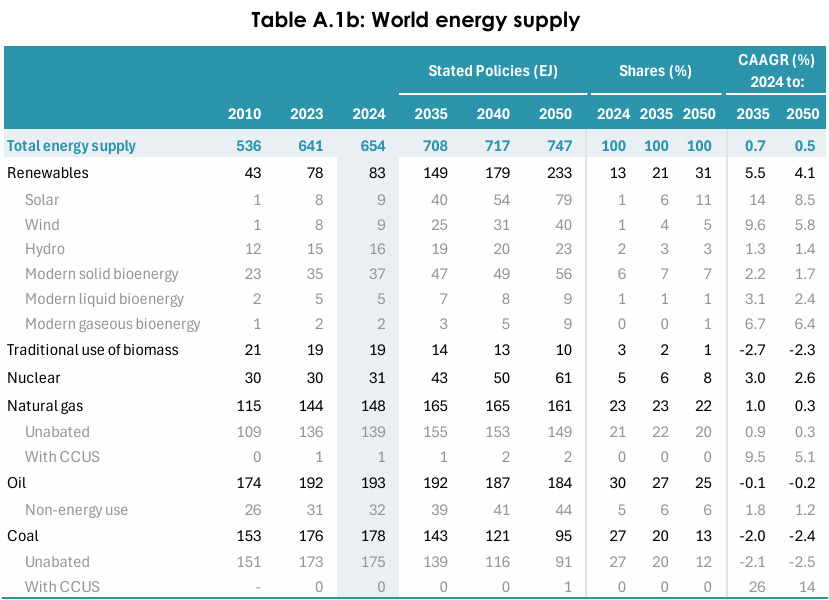
Page 420.
We are running out of rivers to kill however, and the ones we've already killed are drying out - just wait until the Himalayan glaciers are gone - as noted in Nature:
Grill, G., Lehner, B., Thieme, M. et al. Mapping the world’s free-flowing rivers. Nature 569, 215–221 (2019).
From the abstract:
Only ...37 per cent of rivers longer than 1,000 kilometres remain free-flowing over their entire length and 23 per cent flow uninterrupted to the ocean. Very long FFRs are largely restricted to remote regions of the Arctic and of the Amazon and Congo basins. In densely populated areas only few very long rivers remain free-flowing, such as the Irrawaddy and Salween. Dams and reservoirs and their up- and downstream propagation of fragmentation and flow regulation are the leading contributors to the loss of river connectivity...
A map from the full text:
 ?as=webp
The caption:
Of all river reaches in the database, 48.2% (by number) are impaired by diminished river connectivity to various degrees (CSI less than 100%). The blue shades represent the magnitude of river discharge for river reaches with CSI = 100% (that is, darker shades for larger rivers).
To me, an antinuke or an "I'm not an antinuke" antinuke complaining about riverine or riparian ecology is rather like a MAGAT complaining about racism, but that's just me, I guess.
I apologize, again, for my fat fingers and my self deleted post, but am grateful for the opportunity to improve on it.
Thanks again for the little lecture on the use of logical fallacies, and I apologize again, for not taking the complaint seriously. Maybe someone could talk to the "hydrogen will save us" fool about the "guilt by association" and "poisoning the well" fallacies, but um, I'm too lazy or too busy - pick your choice - to do it myself.
Have a nice evening.
OKIsItJustMe
(22,400 posts)11. Sigh... What is Table A.1b?
Excerpts in this reply are drawn from a Creative Commons source:
IEA (2025), World Energy Outlook 2025, IEA, Paris https://www.iea.org/reports/world-energy-outlook-2025, Licence: CC BY 4.0 (report); CC BY NC SA 4.0 (Annex A)
Table A.1b comes from the “Annex” which contains many tables:
General note to the tables
This annex includes global historical and projected data by scenario for the following five datasets:
Each dataset is given for the following scenarios: (a) Current Policies Scenario (CPS) [Tables A.1a. to A.5a]; (b) Stated Policies Scenario (STEPS) [Tables A.1b. to A.5b]; and (c) Net Zero Emissions by 2050 (NZE) Scenario [Tables A.1c. to A.5c].
You have chosen A.1b the "Stated Policies Scenario" (STEPS) Why not look at table A.1a "Current Policies Scenario" (CPS) or A.1c Net Zero Emissions by 2050 (NZE) Scenario? (this, of course is our goal, if you really care about the climate.)
This annex includes global historical and projected data by scenario for the following five datasets:
- A.1: World energy supply.
- A.2: World total final consumption.
- A.3: World electricity sector: gross electricity generation and electrical capacity.
- A.4: World CO₂ emissions: carbon dioxide (CO₂) emissions from fossil fuel combustion and industrial processes.
- A.5: World economic and activity indicators: selected economic and activity indicators.
Each dataset is given for the following scenarios: (a) Current Policies Scenario (CPS) [Tables A.1a. to A.5a]; (b) Stated Policies Scenario (STEPS) [Tables A.1b. to A.5b]; and (c) Net Zero Emissions by 2050 (NZE) Scenario [Tables A.1c. to A.5c].
It’s surprising you include the table at all, since it includes figures for years which are in the future. You generally refer to this as “soothsaying” (which is bad.) Strange, I thought one of the primary purposes of science was to make predictions… No worries though, these are not predictions, they are scenarios.
From the Executive Summary:
There is no single storyline about the future of energy, which is why the World Energy Outlook presents multiple scenarios, none of which is a forecast. The framework presented in this Outlook is based on the latest and most comprehensive data on policies, technologies and markets, together with rigorous modelling. This allows readers to explore the implications of different choices and pathways.
Scenarios
The World Energy Outlook 2025 (WEO-2025) has three main scenarios. Two of these set starting conditions and then examine where they lead – the Current Policies Scenario (CPS) and the Stated Policies Scenario (STEPS). A third, the Net Zero Emissions by 2050 (NZE) Scenario, maps out a pathway to achieve specific energy and climate-related goals.
The continued rise of renewable energy
The pace varies, but renewables grow faster than any other major energy source in all scenarios, led by solar photovoltaics (PV). In the CPS, where they face stronger headwinds, renewables still meet the largest share of total energy demand growth, followed by natural gas and oil, even though annual solar PV additions in the power sector stall at around today’s levels of 540 GW to 2035. In the STEPS, policy changes mean that the United States has 30% less renewables capacity installed in 2035 than in last year’s Outlook, but at the global level renewables continue their rapid expansion. A boom in solar deployment is accompanied by robust growth across wind, hydropower, bioenergy, geothermal and other technologies, and by improvements in energy efficiency. China continues to be the largest market for renewables, accounting for 45-60% of global deployment over the next ten years across the scenarios, and remains the largest manufacturer of most renewable technologies.
Scenarios
The World Energy Outlook 2025 (WEO-2025) has three main scenarios. Two of these set starting conditions and then examine where they lead – the Current Policies Scenario (CPS) and the Stated Policies Scenario (STEPS). A third, the Net Zero Emissions by 2050 (NZE) Scenario, maps out a pathway to achieve specific energy and climate-related goals.
- The Current Policies Scenario considers a snapshot of policies and regulations that are already in place and offers a cautious perspective on the speed at which new energy technologies are deployed and integrated into the energy system.
- The Stated Policies Scenario considers the application of a broader range of policies, including those that have been formally put forward but not yet adopted, as well as other official strategy documents that indicate the direction of travel. Barriers to the introduction of new technologies are lower than in the CPS, but the STEPS does not assume that aspirational targets are met.
- The Net Zero Emissions by 2050 Scenario takes a different approach, describing a pathway to reduce global energy-related carbon dioxide (CO₂) emissions to net zero by 2050, while recognising that each country will have its own route.
The continued rise of renewable energy
The pace varies, but renewables grow faster than any other major energy source in all scenarios, led by solar photovoltaics (PV). In the CPS, where they face stronger headwinds, renewables still meet the largest share of total energy demand growth, followed by natural gas and oil, even though annual solar PV additions in the power sector stall at around today’s levels of 540 GW to 2035. In the STEPS, policy changes mean that the United States has 30% less renewables capacity installed in 2035 than in last year’s Outlook, but at the global level renewables continue their rapid expansion. A boom in solar deployment is accompanied by robust growth across wind, hydropower, bioenergy, geothermal and other technologies, and by improvements in energy efficiency. China continues to be the largest market for renewables, accounting for 45-60% of global deployment over the next ten years across the scenarios, and remains the largest manufacturer of most renewable technologies.
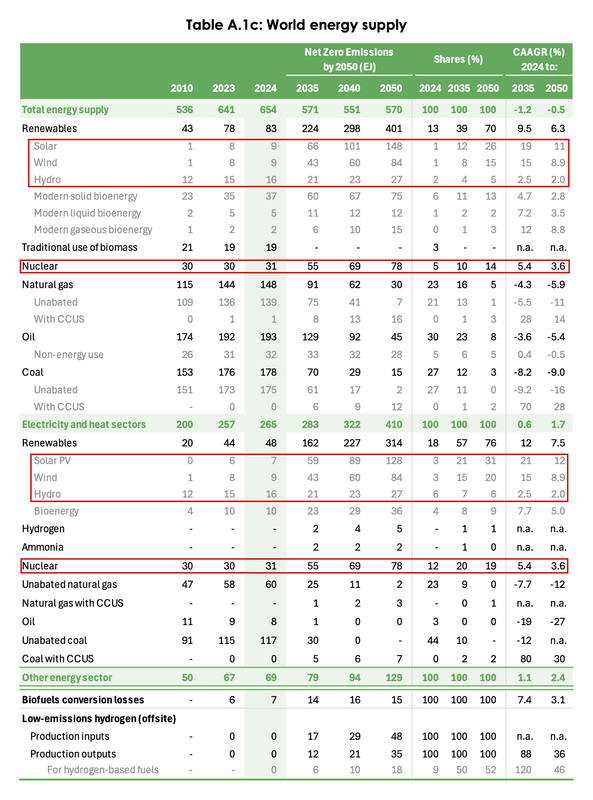
If you read the table, you should see that Solar, Wind & Hydro (combined) already produce more energy than “Nuclear.” Under the Net Zero Emissions by 2050 Scenario, by 2050, Wind by itself will provide more energy than nuclear, and solar will provide almost twice as much.
thought crime
(1,832 posts)3. This is a good example of how Data Science is helping in the investigation of Global Warming
The down-side, of course, is energy consumption from Data Centers.