Environment & Energy
Related: About this forumNew Weekly CO2 Concentration Record Set at the Mauna Loa Observatory, 432.44 ppm
As I've indicated repeatedly in my DU writings, somewhat obsessively I keep spreadsheets of the of the daily, weekly, monthly and annual data at the Mauna Loa Carbon Dioxide Observatory, which I use to do calculations to record the dying of our atmosphere, a triumph of fear, dogma and ignorance that did not have to be, but nonetheless is, a fact.
Facts matter.
When writing these depressing repeating posts about new records being set, reminiscent, over the years, to the ticking of a clock at a deathwatch, I often repeat some of the language from a previous post on this awful series, as I am doing here with some modifications now. It saves time.
The most recent post (not my last on this topic, assuming I live through this year) reflecting updating this last year is below.
The readings are, as of this morning as follows:
Week beginning on April 26, 2026: 432.44 ppm
Weekly value from 1 year ago: 430.29 ppm
Weekly value from 10 years ago: 407.86 ppm
Last updated: May 03, 2026
Weekly average CO2 at Mauna Loa
This is the new all time highest record, 432.44 superseding , 431.73 ppm, set a few weeks ago:
New Weekly CO2 Concentration Record Set at the Mauna Loa Observatory, 431.87 ppm, as I noted in a similar post on April 12th.
As I always remark in this series of posts, if one looks, one can see that the rate of accumulation recorded at the Mauna Loa CO2 Observatory is a sine wave superimposed on a roughly quadratic axis:

Monthly Average Mauna Loa CO2
We should always expect the final "all time record" in late April or in May, whereupon the concentrations will decrease until late September or October; this one which may not be the last for the year, is in May.
Weekly average CO2 at Mauna Loa
In 2025, the then highest value ever recorded 430.83 ppm took place in the week beginning May 5, 2025, and fell thereafter. In 2024, the then highest value ever recorded 427.94 ppm took place in the week beginning April 21, 2024, and fell thereafter. In 2023, the then highest value ever recorded 424.64 ppm took place in the week beginning May 28, 2023, and fell thereafter. In 2022, the then highest value ever recorded 421.63 ppm took place in the week beginning May 29, 2022, and fell thereafter and so on.
If we focus on the week to week comparators over a ten year period the situation is even more dire.
All but one of the top 50 ten year week to week comparators have taken place since 2024. The one that didn’t occurred in 2021. However this week is not in the top 50.
As it happens - I consider it statistical noise - 2026 has started out as a rather mild year for new accumulations of the dangerous fossil fuel waste carbon dioxide in the planetary atmosphere, when viewed as week to week comparisons with the same week of 2025. Only three weeks in 2026 have seen an increase over 3.00 ppm over that of 2025, that of week 8, the week beginning February 22, 2026, when the increase over week 8 of 2025 was 3.04 ppm, and week 13, beginning March 29, 2026. Overall however, the 21st century is appalling on this metric. In the 20th century, going back to 1976, 3.82% of weekly readings recorded and compared to the previous year exceeded 3.00 ppm. In the 21st century, 16.83% of weekly readings recorded and compared to the previous year exceeded 3.00 ppm.
One may wish to argue that the mild readings at the outset of 2026, the current reading notwithstanding, is all about solar and wind crap - all of which will be landfill in 20 to 25 years along with the batteries, with battery and hydrogen redundancy schemes designed to obscure that so called "renewable energy" is actually backed up by dangerous fossil fuels - that it is not, irrespective of my sense to the contrary - statistical noise.
I suspect that recent lower measurements, including a very rare negative reading compared to a week of previous year (week 15 of 2026 compared to week 15 of 2025) are tied to the Orange Pedophile in the White House's war, depriving poor people of the ability to consume petroleum and gas.
People love to jump up and down celebrating the useless solar and wind industries despite their odious failure to address the collapse of the planetary atmosphere. I hear lots and lots of prattling about solar and wind in China - ignoring the huge tragedy of rather dirty lanthanide mines in Baotou - while no success is attributed to the fact that China has built 61 new nuclear reactors in this century, and has 38 under construction, a rate of nuclear construction not seen since the construction of more than 100 reactors in the United States, and over 50 in France in the 20th century.
Actually, though, my firm contention that nuclear energy is the only sustainable form of climate gas free energy that is acceptable and sustainable notwithstanding, I don't really believe the noble nuclear efforts of China are having much effect. It's helpful, but hardly enough. In a sustainable world, we would need thousands of nuclear reactors, not hundreds.
Assuming that the Mauna Loa CO2 Observatory is not shut by the anti-science bigots who have seized control of our government and canceled our Constitution, we are likely to see higher readings this year. The consequences, irrespective of whether the numbers are available and honestly reported, will not be subject to lies or misrepresentations by potentially thuggish liars; the planet will continue to burn, the weather will become more extreme and out of control. Oh and assholes will still carry on about how nuclear energy is "too dangerous," and the destruction of the planetary atmosphere is not "too dangerous."
These people will tell us, in a delusional counterfactual statement that so called "renewable energy" will save us. These chanting people who chant that "renewable energy" will save us and that nuclear energy is "too dangerous," will continue to so chant despite the observable fact that "renewable energy" has not saved us, isn't saving us, and, I assert, won't save us. People say we "need" solar and wind. We don't. They remain trivial sources of primary energy, their much hyped, in mathematically illiterate “percent” talk cannot keep pace with the growth in the use of dangerous fossil fuels. They have not and cannot stop dangerous fossil fuel wars, nor can they arrest the rising death toll from air pollution associated with dangerous fossil fuels.
The reactionary impulse to make our energy supplies dependent on the weather, this precisely at the time we have destabilized the weather by lying to ourselves about our continuous and rising use of dangerous fossil fuels, was always an ignorant attack on nuclear energy. It was never about preventing the extreme global heating we now observe, never about the environment (you don't tear the shit out of wilderness to make industrial parks and declare yourself "green" ) and never about costs, since the required redundancy - while kept off the books dishonestly - is expensive, and, as it is almost always fossil fuel based, dirty.
It is interesting and notable that the same people who still carry on with stupid reference to putative "costs" of nuclear energy that they themselves caused with picayune objections - they couldn't give a fuck about the cost of the extreme global heating we are now experiencing - and attack nuclear energy on this basis are completely and totally disinterested in attacking the unimaginable external costs of dangerous fossil fuels, costs recorded in millions of deaths and expensively treated diseases each year, the destruction of vast ecosystems by fire and alternately inundation or just plain heat.
Irrespective of their inane anti-science rhetoric about batteries and hydrogen, as it disregards the laws of thermodynamics, an apologetic orgy of wishful thinking designed to make the failed solar and wind industries appear to be reliable, which they will never be, all the money spent on solar and wind is clearly wasted and ineffective. The impulse is reactionary, to make our energy supplies depend on the weather, precisely at the time we have destabilized the weather because the reactionary fantasy is not working.
How much money is it?
The size of investment in so called "renewable energy" is 5.689 trillion dollars, compared to 592 billion dollars spent on nuclear energy (including a vague term the IEA calls "other clean energy" ), much of the latter to prevent the willful and deadly destruction of existing nuclear infrastructure. Presumably "other clean energy" includes fusion, which has provided zero useable energy for any purpose. As for fusion, magnetic confinement fusion relies on superconducting magnets, cooled by liquid helium. The world supply of helium is affected by the Orange Pedophile’s war in the Persian Gulf. (It won’t happen anyway.)
My strong opinion that nuclear energy is the last best hope of the planet is not subject to change by appeals to clap trap about so called "nuclear waste," the big bogeymen at Fukushima, Chernobyl (and even more silly) Three Mile Island, blah, blah, blah...
I suggest finding someone more credulous than I to whom to chant endlessly about these points. Take a drive in your swell car out to a "no nukes" concert and convincing yourself that rock stars know more about energy than engineers and scientists. You deserve it. Whether future generations suffer in extreme poverty because of your smug pleasures and appalling selective attention is not your concern.
Oh, and of course, be sure self identify as an "environmentalist." As one who gives a shit about extreme global heating, I won't credit this self identification anymore than I credit Donold Trump's descriptions of himself as a "very stable genius" and all that, but who cares what I think? The "...but her emails..." and "...sane washed Donold Trump..." media describes antinukes as "environmentalists" after all, even if I find that absurd and delusional, so there's that.
Be sure to prattle on about your complete and total indifference to the laws of thermodynamics, laws of physics that are not subject to repeal by appeals to wishful thinking, by carrying on about energy storage, lots of battery bullshit, hydrogen bullshit, etc. as if there was enough so called “renewable energy” to store for months at a time. There hasn’t been any such "renewable energy" surfeits, to justify this junk, there aren't any and there won’t be any, but none of this should prevent you from the ruined landscapes and mining pits you leave for future generations don’t exist, that they’re “green.” Screw future generations. If they need resources, they can sort through our landfills and ruins.
Tell everyone you know that it’s OK to spend ten times more money on solar and wind as we spend on nuclear energy, even though the trillion dollar quantities squandered on them haven’t done a damned thing to address extreme global heating, aren’t doing a damned thing to address extreme global heating, and won’t do anything to address extreme global heating, but will leave a legacy of dead industrial parks where wilderness used to be.
Do all these things. Don't worry. Be happy.
Our media will declare you an “environmentalist.” Good for you.
As for me, I’m far more concerned with the collapse of the planetary atmosphere than I am with the fear that someone somewhere at some time may die from an industrial accident involving radiation. Let me repeat: I am far more concerned with the vast death toll, extreme environmental destruction, and the global heating associated with the normal use of dangerous fossil fuels than I am about carrying on insipidly about Fukushima.
Nuclear energy is not risk free, nor will it ever be. It is simply vastly superior to all other options, which in a rational world, as opposed to the one in which we live, would be enough to embrace it.
When our country, as precious as it has been to us, is an ancient memory, the rot we left behind in the planetary atmosphere will yet persist.
History, should history remain recorded and accessible, will not forgive us, nor should it.
Have a pleasant Sunday afternoon.
 = new reply since forum marked as read
Highlight:
NoneDon't highlight anything
5 newestHighlight 5 most recent replies
= new reply since forum marked as read
Highlight:
NoneDon't highlight anything
5 newestHighlight 5 most recent replies

Cirsium
(4,055 posts)Thanks for your work to bring attention to these issues.
When the first European settlers arrived here (upper Midwest) the old growth stands of White Pine, Beech, and Maple were clear cut. To build houses? To build furniture? No. The timber was carried to docks along the Lake Michigan shore and sold to passing ships to be burned as fuel.
Now, 150 years later land is being clear cut here and the timber is then turned into pellets and sold overseas as a "renewable fuel." See how "green" we are now?

OKIsItJustMe
(21,994 posts)We may as well attribute rising atmospheric CO₂ to an over-reliance on Nuclear Power, that’s not the problem, and neither is the use of renewables.
(Please note: The following content is taken from a Creative Commons source.)
IEA (2026), Global Energy Review 2026, IEA, Paris https://www.iea.org/reports/global-energy-review-2026, Licence: CC BY 4.0
Energy sector emissions continued to rise in 2025, but regional trends varied markedly
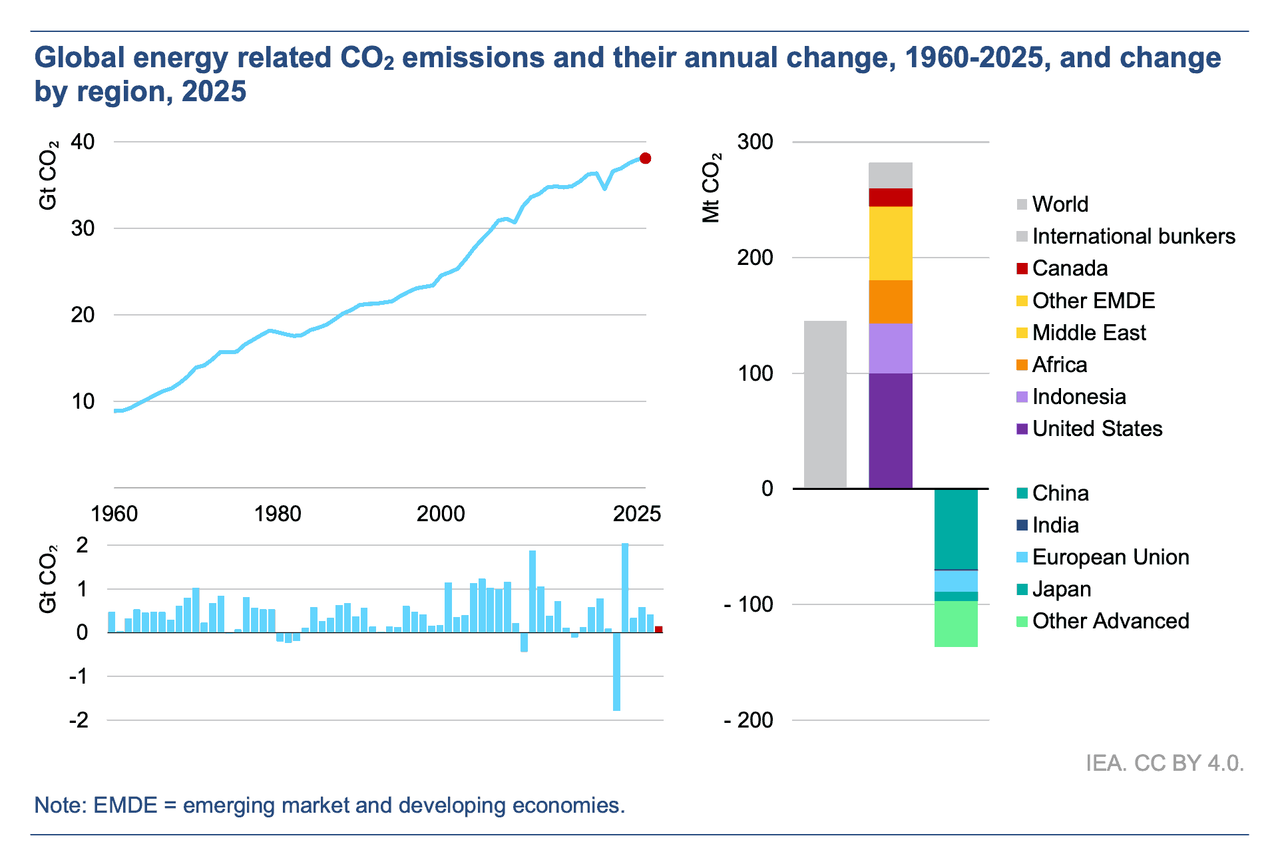
Global growth in energy-related CO₂ emissions slowed in 2025, rising by around 0.4%, the slowest rate since 2021. Despite this slowdown, total energy-related CO₂ emissions increased by around 145 million tonnes (Mt) in 2025, reaching a new high of nearly 38.4 billion tonnes (Gt) ² , and 5% above 2019 levels. The increase coincided with record atmospheric CO₂ concentrations of about 427 parts-per-million (ppm), roughly 2.4 ppm higher than in 2024 and around 50% above pre-industrial levels.
Emissions from fuel combustion grew by close to 0.5% (around 185 Mt CO₂ ), while emissions from industrial processes declined by roughly 2% (about 40 Mt CO₂ ), partially offsetting the overall increase. Emissions growth remained below the pace of global economic expansion (global GDP increased by about 3.1% in 2025), indicating a continued decoupling between emissions and economic activity following the disruption observed earlier in the decade.
For the first time since the 1990s, advanced economies saw higher emissions growth than emerging economies
In 2025, global energy-related CO₂ emissions rose more strongly in advanced economies than in emerging market and developing economies for the first time in nearly 30 years. Emissions in advanced economies increased by 0.5%, while in emerging market and developing economies, growth slowed to 0.3%.
Emissions in China declined by around 0.5%, reflecting continued reductions in emissions from both industrial processes and electricity generation. This was mainly driven by a surge in low-emissions generation combined with slower electricity demand growth compared with 2024, and a notable contraction in cement and steel production. However, these effects were partially offset by the chemical industry. In emerging market and developing economies excluding China, emissions increased by 1.1%, significantly below the 2.2% average annual growth observed over the past five years, with India a major contributor to this slowdown. Emissions in India dipped in 2025, driven primarily by weather effects linked to an earlier and stronger monsoon cycle, alongside continued robust expansion of renewable energy capacity.
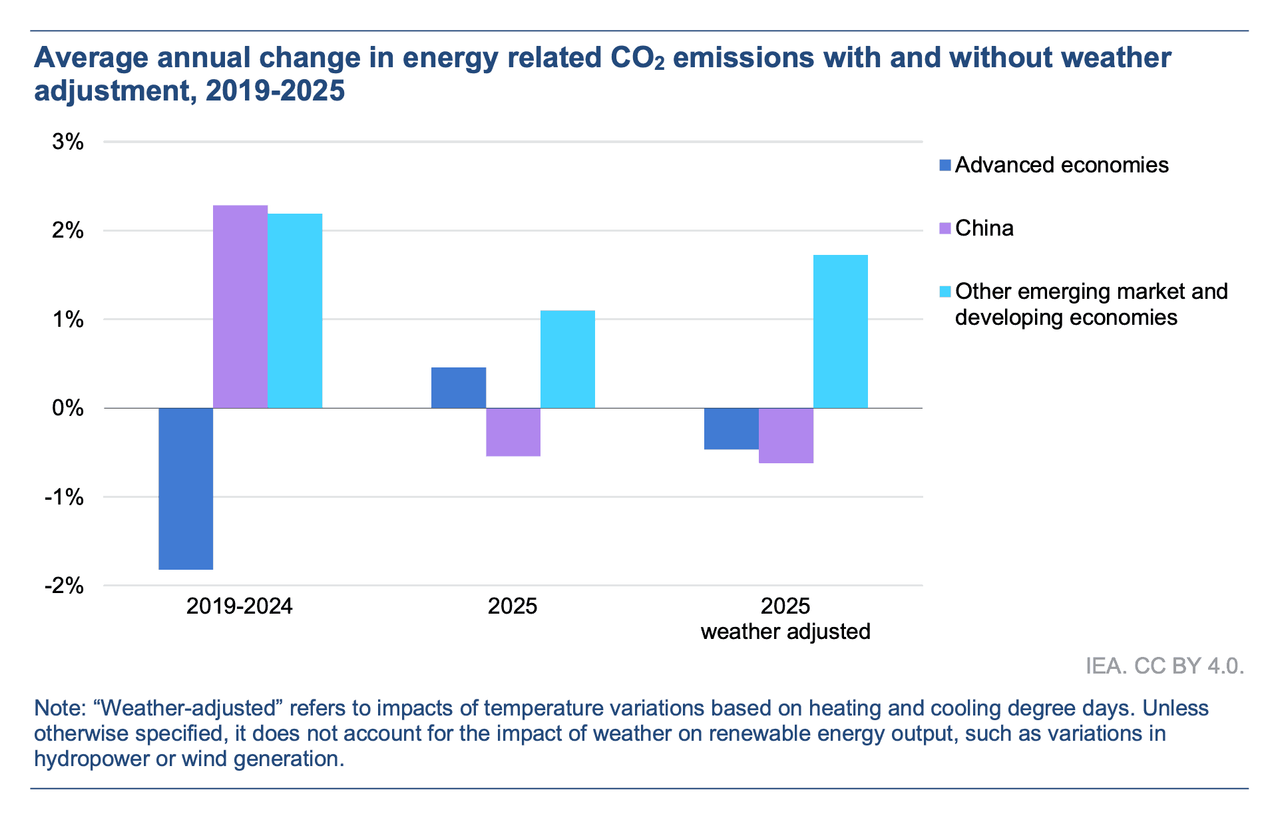
Outside of China, annual emissions trends were largely driven by weather effects. In advanced economies, colder winter conditions boosted heating demand, increasing natural gas consumption in buildings and the power sector. By contrast, reduced cooling needs in many emerging markets and developing economies moderated coal and electricity demand growth. On a weather-adjusted basis, CO₂ emissions in advanced economies would have declined by around 0.5%, reflecting continued structural improvements in energy efficiency and clean energy deployment. In emerging markets and developing economies outside of China, emissions would have increased by around 1.7% as weather played a substantial role in curbing emissions growth, notably in India and Southeast Asia.
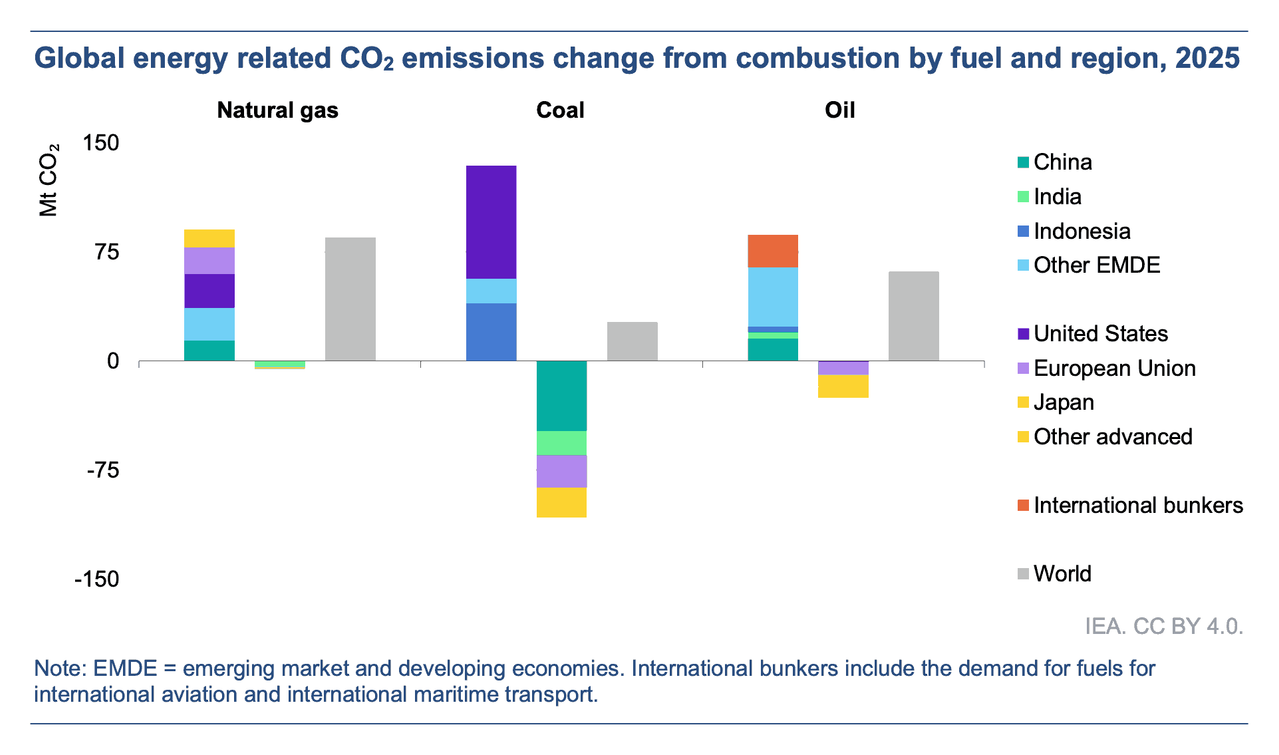
Natural gas drove CO₂ emissions growth while coal emissions plateaued
Natural gas was the largest contributor to the increase in global energy-related CO₂ emissions in 2025. Of the total 185 Mt CO₂ rise in emissions from fuel combustion, natural gas accounted for nearly half, or 85 Mt CO₂ , followed by oil at 60 Mt. Coal emissions plateaued, increasing by 25 Mt CO₂ (compared to 210 Mt CO₂ in the previous year), masking divergent regional trends. Higher natural gas prices supported gas-to-coal switching in the United States, adding more than 75 Mt, while China’s coal emissions fell, reflecting the country’s 1.4% decline in coal power generation. The increase in oil-related emissions was concentrated in China, India and other emerging market and developing economies, where rising transport activity and economic growth continued to support higher oil demand.
Weather effects also played a significant role in shaping fuel-specific trends in 2025. More than 40% of the growth in global natural gas demand was linked to higher heating needs in advanced economies, where colder winter conditions boosted consumption in buildings and the power sector. In India, lower coal use reflected reduced cooling demand due to milder temperatures and an earlier monsoon season. We estimate that weather effects decreased coal demand by around 8 million tonnes of coal equivalent (Mtce) in the country, reducing CO₂ emissions by over 20 Mt.
Temperature swings and drought conditions pushed up emissions
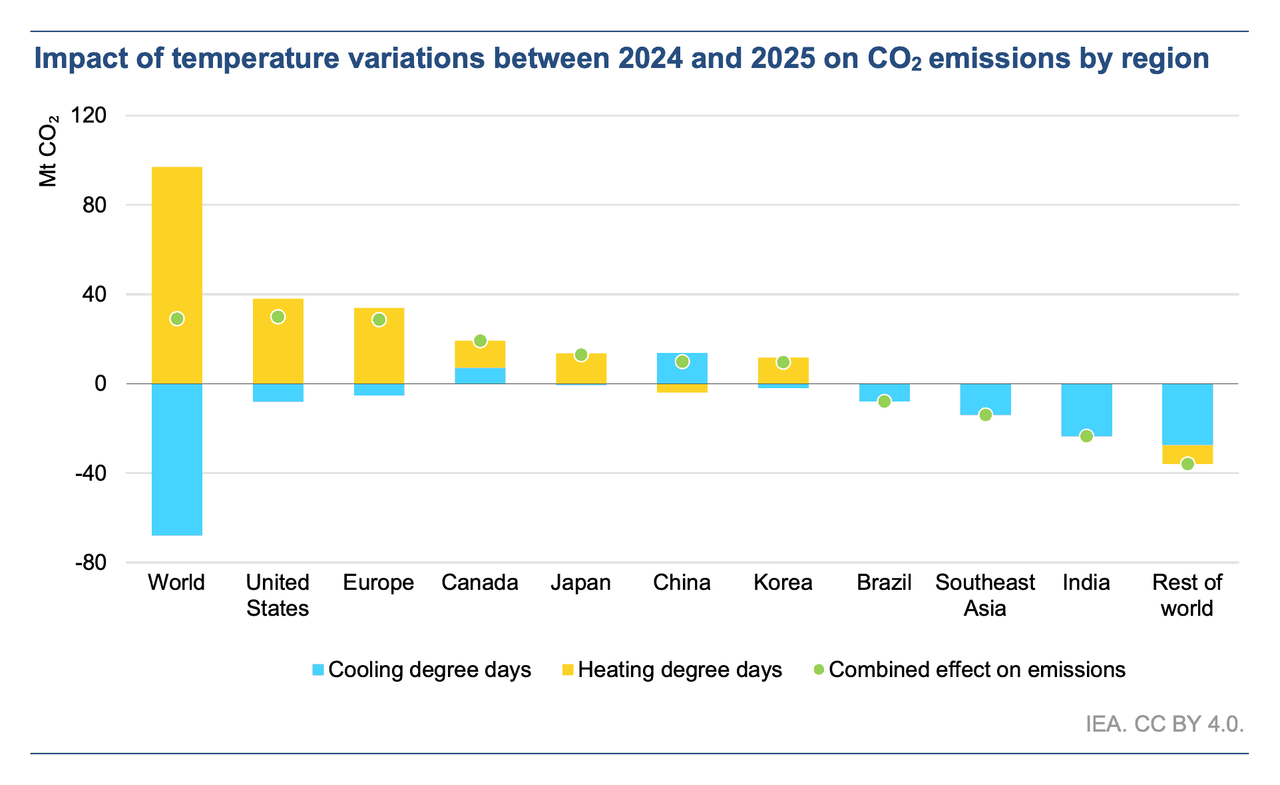
Global energy demand was shaped by continued temperature volatility in 2025, which was the third warmest year on record – slightly cooler than the record set in 2024. An earlier and more widespread monsoon season brought increased rainfall and cloud cover in India and Southeast Asia, reducing extreme heat and lowering air conditioning use. Without these milder conditions, the coal demand increase would have been around 30% higher globally. Despite this easing, cooling degree days remained well above the long-term average between 2000 and 2019, sustaining elevated electricity needs in many regions. At the same time, colder winters in advanced economies increased heating degree days and shifted energy consumption toward heating fuels compared with 2024.
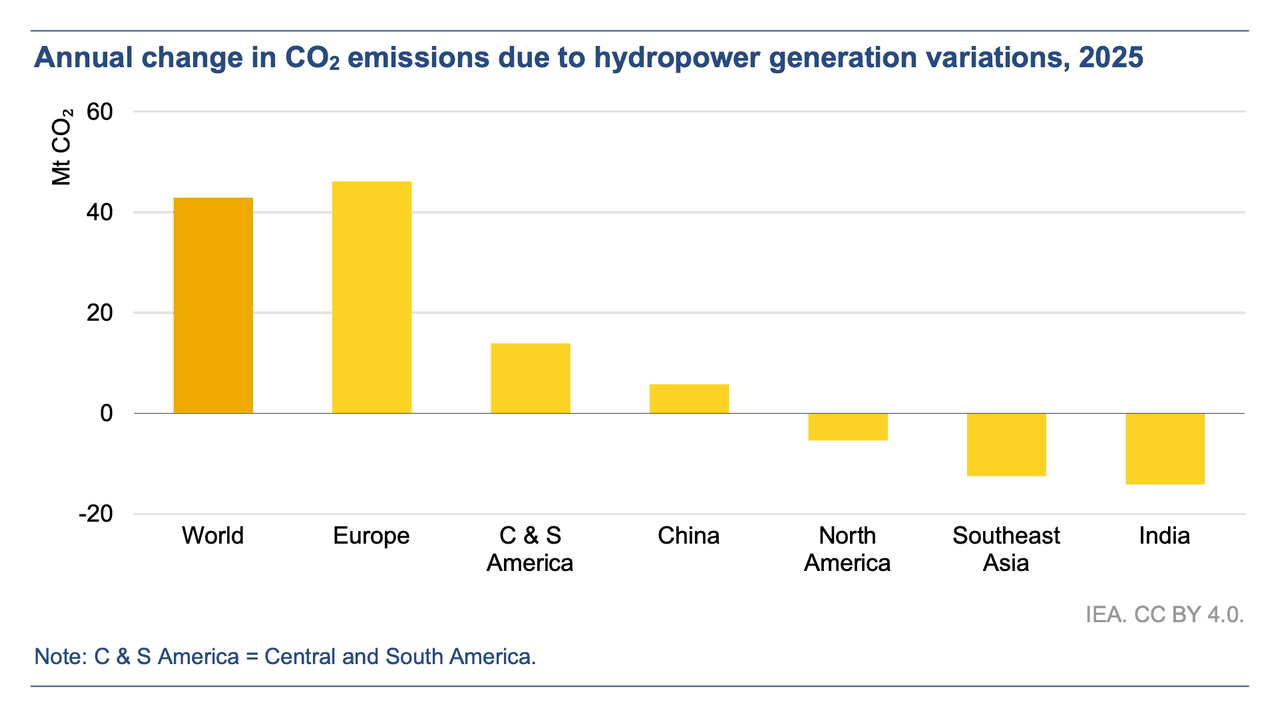
Beyond temperature effects, drought conditions in several regions, particularly in Europe and across Central and South America, constrained hydropower output. The resulting shortfall was largely met by higher fossil fuel output, leading to an estimated additional 40 Mt of CO₂ emissions globally.
Europe was largely drier than normal, and hot summer temperatures exacerbated drought conditions, particularly in western and eastern portions of the continent. Had the availability of the hydropower fleet in 2025 remained consistent with 2024 levels, an additional 75 TWh of electricity would have been generated in the region, avoiding around 45 Mt of CO₂ from fossil fuel-based power plants. Weaker average daily wind speeds also reduced wind power output compared to 2024, increasing reliance on fossil-fuel based generation. If wind conditions had been the same as 2024, over 20 Mt CO₂ would have been avoided in Europe.
Excluding winter precipitation, India recorded above-normal rainfall across all seasons, with May precipitation reaching its highest level since 1901. This early onset of the southwest monsoon boosted hydropower output and contributed to an estimated reduction in emissions of around 15 Mt CO₂.
We estimate that the net impact of weather-related factors – including temperature variations and shortfalls in hydropower and wind – pushed up CO₂ emissions from the combustion of fossil fuels by around 90 million tonnes in 2025, accounting for around half of the total 185 Mt rise in combustion emissions.
————————————
² This includes CO₂ emissions from fuel combustion, industrial processes, and fugitive (flaring). Elsewhere in this report, unless explicitly mentioned, CO₂ emissions refer to emissions from fuel combustion and industrial processes excluding fugitive (flaring).
IEA (2026), Global Energy Review 2026, IEA, Paris https://www.iea.org/reports/global-energy-review-2026, Licence: CC BY 4.0

NNadir
(38,391 posts)...and their wind and solar garbage.
I have never, not once, met one who notices the results written in the planetary atmosphere, clearly show useless the results their bourgeois affectation has been, is, and always will be.
It's all "nearer my god to thee" on the Titanic not worth a damn. Religious faith in aeolian gods and sun gods aren't worth shit.
A clueless bunch, the trillions soaking antinukes.
OKIsItJustMe
(21,994 posts)NNadir
(38,391 posts)Last edited Sun May 3, 2026, 07:43 PM - Edit history (2)
It's not from a cute video from any source or paper working to justify the squandering of investment in so called "renewable energy" of 5.689 trillion dollars for no result. It's not "spin;" it's not cheering for obscene and frankly depressing destruction of wilderness shown in the opening picture of the video that I am far too disgusted to watch. It's not about applauding land developers, copper mines, batteries or any other of that useless junk, spreading fragile glass over vast stretches of land, or about cows grazing under solar cells.
It's from, again, data.
Now.
The data is obtained from a single variable, time, yielding a single dependent variable, concentration of the dangerous fossil fuel waste carbon dioxide. As noted in the OP for any one with a modicum of reading comprehension:
It refers to this graph, again always produced, every damn time I post about these new terrifying records, every spring, every year, for how ever many years I've been at it:
I would expect a competent high school student - I'm sure my son could have done this when he was 15 years old - to be able to generate a quadratic equation by simple integration of the data, as I described here in 2022:
Let's do something very, very, very crude, just as an illustration with the understanding that it is unsophisticated but may be illustrative:
As of this writing, I have been a member of DU for 19 years and 240 days, which works out in decimal years to 19.658 years. This means the second derivative, the rate of change of the rate of change is 0.04 ppm/yr^2 for my tenure here. (A disturbing fact is that the second derivative for seven years of similar data running from April of 1993 to April of 2000 showed a second derivative of 0.03 ppm/yr^2; the third derivative is also positive, but I'll ignore that for now.) If these trends continue, this suggests that “by 2050,” 28 years from now, using the language that bourgeois assholes in organizations like Greenpeace use to suggest the outbreak of a “renewable energy” nirvana, the rate of change, the first derivative, will be on the order of 3.6 ppm/year. Using very simple calculus, integrating the observed second derivative twice, using the boundary conditions – the current data - to determine the integration constants, one obtains a quadratic equation (0.04)t^2+(2.45)t+ 419.71 = c where t is the number of years after 2022 and c is the concentration at the year in question.
A Commentary on Failure, Delusion and Faith: Danish Data on Big Wind Turbines and Their Lifetimes. The boundary conditions in the text above were those of 2022, when the post about the lifetime of Danish wind junk was written.
The spreadsheet I use to keep track of the data produced by the Mauna Loa CO2 Observatory updates the boundary conditions determined by the data of the simple 2nd order differential equation that again, a reasonably precocious high school student in 10th or 11th grade should be able to solve to model the quadratic axis, two simple integrations.
It gives a crude, but reasonably accurate, I think model for the data. (It would probably be instructive for a kid to learn about modeling using this very, very, very, very simple case. It beats the shit out of the leaky bucket problem they gave when I was in high school.)
It predicts 500 ppm in January of 2045, and about 513 ppm in 2050.
I'm sure in 2050, antinuke "renewable energy will save us" cults will still be predicting a so called "renewable energy" nirvana. No amount of data, no amount of information can change the dogma of a cult, not a burning world, destabilized weather of alternate droughts and floods, extreme heat, dead rivers, failed crops. I mean here we are and still we hear this shit.
Or alternatively, in a world strewn with the wreckage of obscene solar and wind junk, all of the world's most valuable mines played out, the forests burned, sunken cities, they'll be no time or resources for cults.
If there is history still, perhaps its practitioners in whatever academies that remain will wave angry fingers at the people responsible for these literally earth shattering - destructive on a planetary scale - delusions.
By the way, there is no inflection in the data, none at all, on inspection for the onset of the mining and wilderness destroying expenditure of that more than 5 trillion dollars beginning in 2015. It's unchanged.
On inspection.
I repeat my only real exercise in soothsaying:
History will not forgive us, nor should it.
Hand this video to someone more credulous than I'm willing to be, cheering for the grazing cows under solar cells. I'm not buying it.
Have a nice week.
OKIsItJustMe
(21,994 posts)The video from Science is not a “cute video.” It’s Science. But, then, you don’t like Science that disagrees with your… uh… “alternative facts.”
https://www.science.org/content/article/breakthrough-2025
BREAKTHROUGH OF THE YEAR
18 DEC 2025 2:00 PM ET
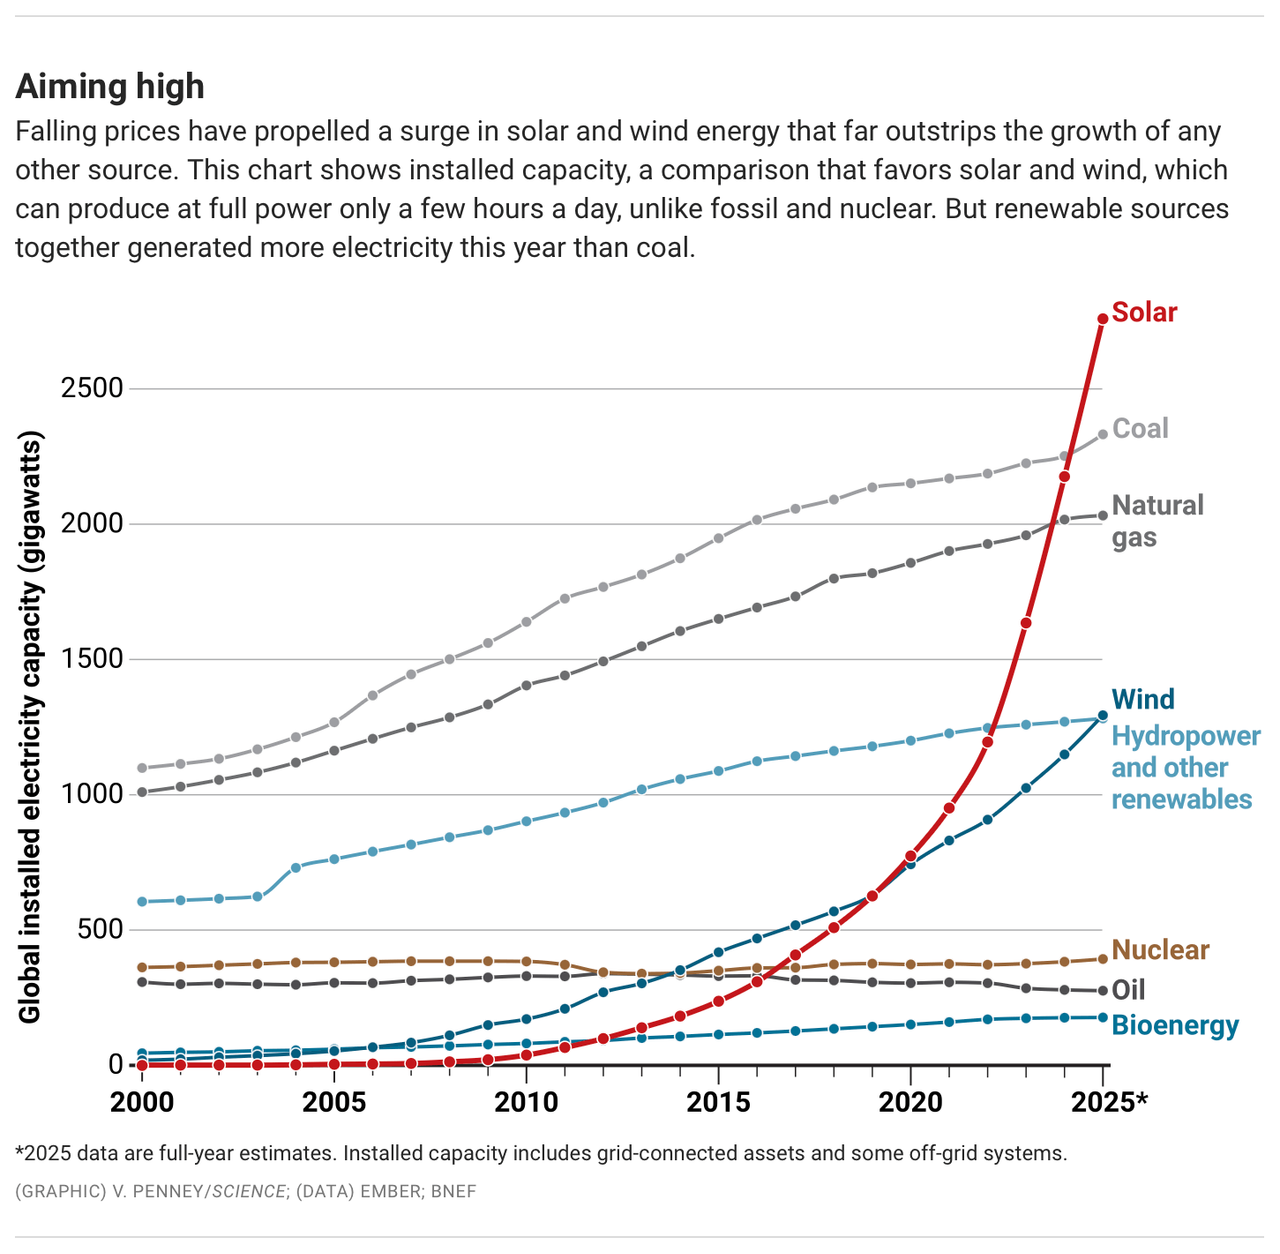
GOOD MORNING, SUNSHINE
The seemingly unstoppable growth of renewable energy is Science’s 2025 Breakthrough of the Year
BY TIM APPENZELLER
Since the Industrial Revolution, human society has run on ancient solar energy—captured by plants hundreds of millions of years ago, stored in fossil fuels, and dug and drilled from the earth. But this year momentum shifted unmistakably toward the energy that streams from the Sun today. Renewable energy, most of it from sunlight itself or from wind, ultimately driven by the Sun, overtook conventional energy on multiple fronts.
This year, renewables surpassed coal as a source of electricity worldwide, and solar and wind energy grew fast enough to cover the entire increase in global electricity use from January to June, according to energy think tank Ember. In September, Chinese President Xi Jinping declared at the United Nations that his country will cut its carbon emissions by as much as 10% in a decade, not by using less energy, but by doubling down on wind and solar. And solar panel imports in Africa and South Asia have soared, as people in those regions realized rooftop solar can cheaply power lights, cellphones, and fans. To many, the continued growth of renewables now seems unstoppable—a prospect that has led Science to name the renewable energy surge its 2025 Breakthrough of the Year.
That promise comes against a backdrop of downbeat news, highlighted at the U.N. climate meeting in Belém, Brazil, in November. Global carbon emissions continue to creep up as countries fall short of cuts pledged in the 2015 Paris climate agreement. The goal of limiting global warming to 1.5°C—always a long shot—now seems completely out of reach. But Hannah Ritchie, a data scientist at the University of Oxford and a climate blogger, is among those who see hope. Thanks to renewables, the long-awaited decline of fossil fuels is in sight, she says. China is “just, just on the cusp … of actually starting to push out coal,” and fossil fuel use in the rest of the world is likely to follow.
…
…
Technological progress could power future gains. Solar cells today are made of crystalline silicon, but another kind of crystal, perovskites, can be layered in tandem with silicon to make cells that gain efficiency by capturing more colors of light. Material advances are enabling wind turbine blades to get longer and harvest more energy, while designs for floating turbines could vastly expand the offshore areas in which they could be deployed. And the giant lithium-ion batteries now used to store energy when sunshine and wind falter could one day give way to other chemistries. Vanadium flow batteries and sodium batteries could be cheaper; zinc-air batteries could hold far more energy.
…
NNadir
(38,391 posts)This is an equation, familiar to nuclear engineers which in the trivial case, refers to radioactive decay series wherein the amount at which an entity is destroyed dN/dt is proportional to the amount of the entity that exists, N. In this trivial case the integration is very simple and gives a simple exponential. Now if an entity is formed at the same time it's created, it's a little more complex, and what develops is a steady state, an equilibrium, where something is being destroyed at the rate at which it (can) form.
Now if someone wants to tell me that the climate issue is fully solved and addressed, many of us have a word for it here at DU. It's called "denial."
Some of us hold denial in contempt, noting that the weather is increasingly destabilized, among other things.
Now for the Bateman application to the use of solar cells, besides factors like the Stabler Wronski effect and other degradation mechanisms such as the burnout of inverters and other junk, there's the factor that all the solar bullshit has done nothing to address the collapse of the planetary atmosphere, resulting in, again, to repeat, again and again and again, destabilized weather
From Inside Climate News:
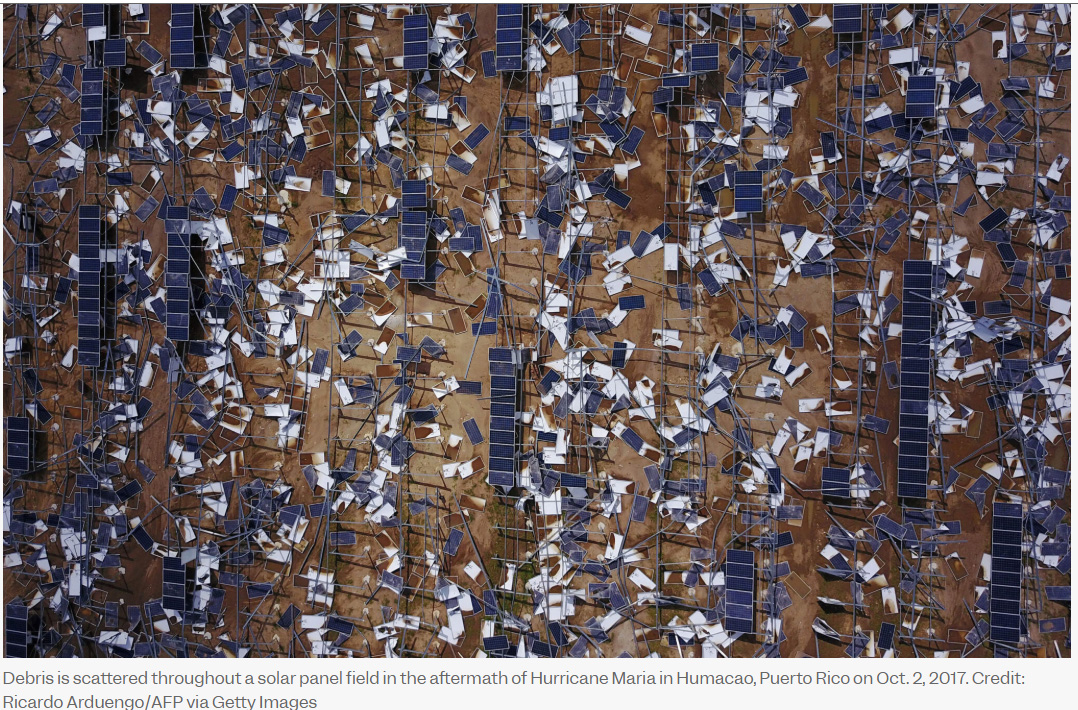
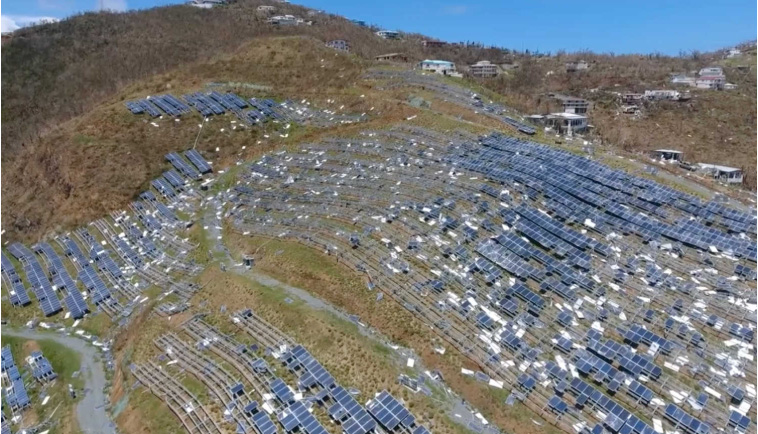
Virgin Group Company BMR Energy Announces Plans to Rebuild St. Thomas Solar Farm
Renew Economy:
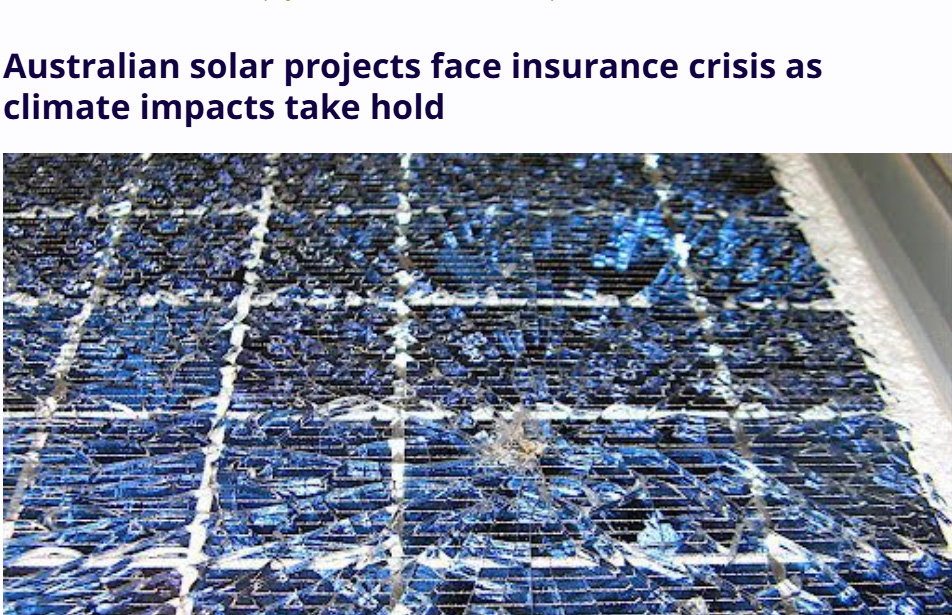
Solar groups deny damage, pollution claims after Danas
(There's reference to denial again.)
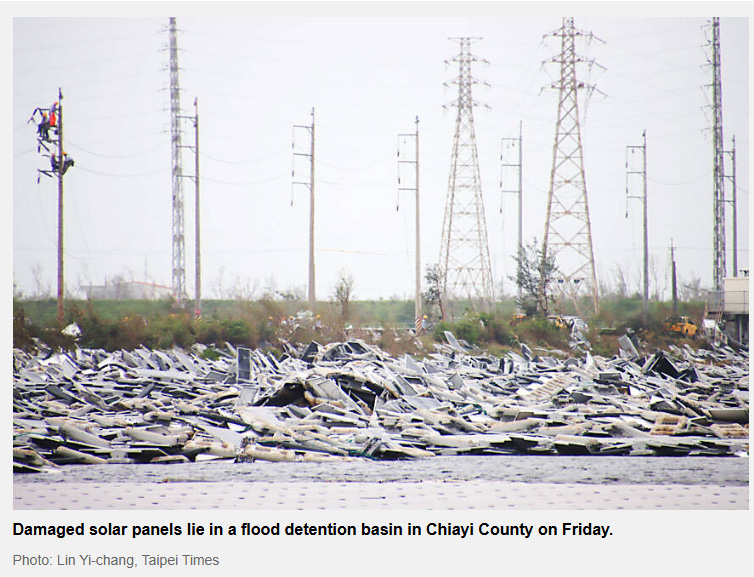
Why the solar revolution is in grave danger—and how it can be saved
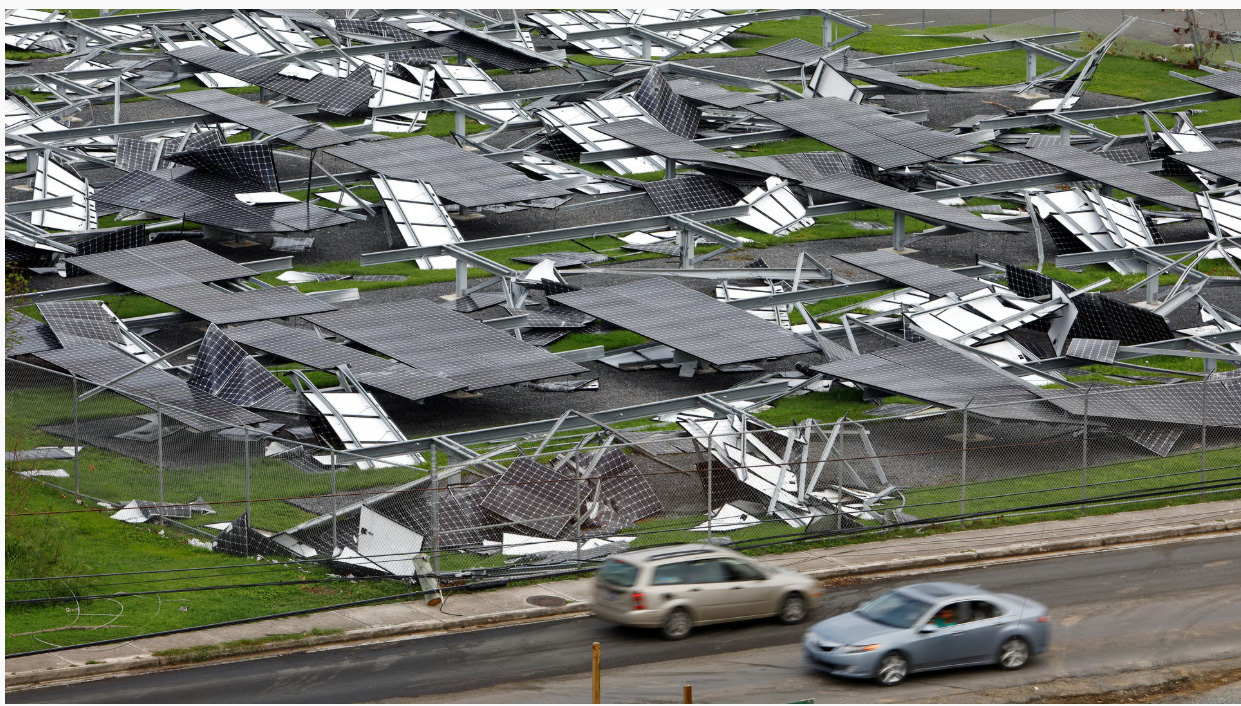
We could go on quite some time with these as opposed to all the bizarre - at least I find it bizarre - pictures of intact solar industrial parks covering obscenely large tracts of land to provide energy for a few hours per day, while relying on fossil fuels the rest of the time.
So out with it?
Are we really saved by this trillion dollar solar "miracle" or is the fucking atmosphere's collapse still going on with no demonstrable effect?
In my tenure here, beginning in November of 2002, while listening to, and once being delusional enough to believe in this forever solar "miracle," the increase in the concentration of the dangerous fossil fuel waste has been 58.47 ppm as of this morning. The rise has never stopped, and the rate of the rise is increasing, from 18.00 ppm/10 years to 25.85 ppm/10 years as of this morning.
Everything's just fine? Really?
Instead of posting graphs, I would recommend that person posting them be able to understand what they mean, but that's just me.
The fucking graphs have not done a fucking thing to put out the fires.
By the way:
I have never met a denialist antinuke able to distinguish the difference between a unit of (peak, in the solar and wind case) power, the Watt, and the Joule
That explains an awful lot about the inability to grasp what graphics mean.
If anyone is confidently posting graphics in which unreliable systems requiring redundancy is measured in Watts, one can understand how fucking easy it is to lapse into climate denial.
JFC.
OKIsItJustMe
(21,994 posts)I’m not your straw man.
Frankly, I feel the situation is hopeless; but your preferred, “Nothing but nukes,” solution will only kill the planet faster, assuming the world sits on our thumbs and wait for your miraculous nuclear power plants to appear.
Instead, much of the world is successfully working on practical measures, which you don’t like. You know what? Reality doesn’t care if you like it or not.