Economy
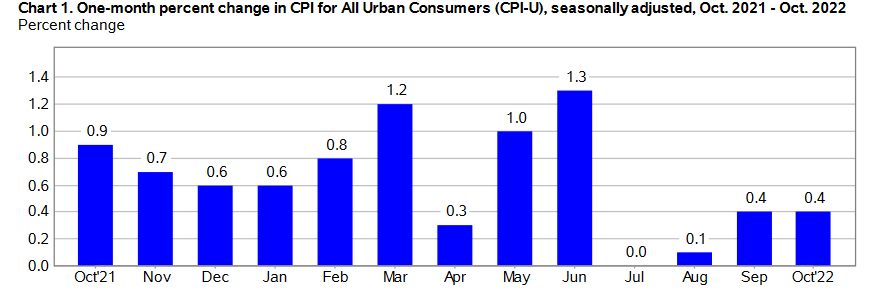
Related: About this forumInflation cooling: last 4 months: CPI: 2.8%, Core CPI: 5.3%, PPI: 0.06%, Core PPI: 2.5% (annualized)
Last edited Wed Nov 16, 2022, 03:52 PM - Edit history (2)
The title line are the last 4 months (October over June) AT AN ANNUAL RATE.
I know I know, you won't find this in the media anywhere. They are fundamentally incapable of reporting anything besides the one month change and the twelve month change. They are fundamentally incapable of understanding that maybe the first several months of a 12 month period are ancient history. And yes, they are fundamentally incapable of calculating inflation rates from the data.
Note also the PPI generally leads the CPI. So that the PPI is 0.06% and Core PPI is 2.5% is a good harbinger for the next CPI report in about a month from now.
CPI https://data.bls.gov/timeseries/CUSR0000SA0
Core CPI http://data.bls.gov/timeseries/CUSR0000SA0L1E
PPI http://data.bls.gov/timeseries/WPSFD4
Core PPI http://data.bls.gov/timeseries/WPSFD49116
CPI = Consumer Price Index,
PPI = Producer Price Index aka wholesale prices
The Core CPI is the CPI less food and energy
The Core PPI is the PPI less food, energy, and trade services
How the 4 month inflation figures were calculated:
https://www.democraticunderground.com/?com=view_post&forum=1002&pid=17358410
===============================================
The markets are noticing too -- interest rates are dropping. The 10 year Treasury was 4.2% on November 8, now at 3.7%. That's a lot of drop in one week.
{#} Treasury Interest Rates
10 Year Treasury - Market Yield on U.S. Treasury Securities at 10-Year Constant Maturity, Quoted on an Investment Basis (DGS10) (FRED)
https://fred.stlouisfed.org/series/DGS10
US Treasury Yield Curve (you can set the date)
https://www.ustreasuryyieldcurve.com/
Select interest rates -- scroll to the Treasury section
https://www.federalreserve.gov/releases/h15/
10-year Treasury Constant Maturity Minus 2-Year Treasury Constant Maturity (FRED)
(This has gone negative before every recession. But not every negative occurance has preceded a recession. If I got that right)
https://fred.stlouisfed.org/series/T10Y2Y
Latest quote and recent history graphs of individual treasuries
1mo Treasury https://www.cnbc.com/quotes/US1m
3mo Treasury https://www.cnbc.com/quotes/US3m
2Y Treasury https://www.cnbc.com/quotes/US2Y
5Y Treasury https://www.cnbc.com/quotes/US5Y
10Y Treasury https://www.cnbc.com/quotes/US10Y
20Y Treasury https://www.cnbc.com/quotes/US20y
30Y Treasury https://www.cnbc.com/quotes/US30y
Yahoo Finance symbols for Treasury yields : 3mo: ^IRX, 5y: ^FVX, 10y: ^TNX, 30y: ^TYX (None for 2y)
https://finance.yahoo.com
doc03
(38,836 posts)economists are predicting inflation will be worse in 20 23 and the other from Goldman Sachs predicting
an inflation rate of I think 2.8% at the end of 2023. My IRA has gained several thousand dollars in the last couple weeks.
It doesn't appear Wall Street is expecting any deep recession next year either.
![]()
Starfury
(856 posts)Graph from another site visualizing BLS inflation data for the last 12 months:
